End User
BisB works under supervision of the Central Bank of Bahrain and is listed on the Bahrain Stock Exchange.
Scope
Design and implementation of a Data Center Monitoring System
Background
It is very important and critical to monitor the inner temperature & humidity to protect the valuable assets inside the data center. Whenever a failure occurs for AC, it will cause a temperature hike and will affect the equipment life. The hike in humidity also damages all electronic devices.
Water leakage due to issues in the A/C System is another problem faced in the data center. But the issues were noticed only when the maintenance personnel paved a visit, so by the time the assets would get damaged. Also, sending a maintenance person to each data center for periodic maintenance consumed time and was a costly routine.
System Description
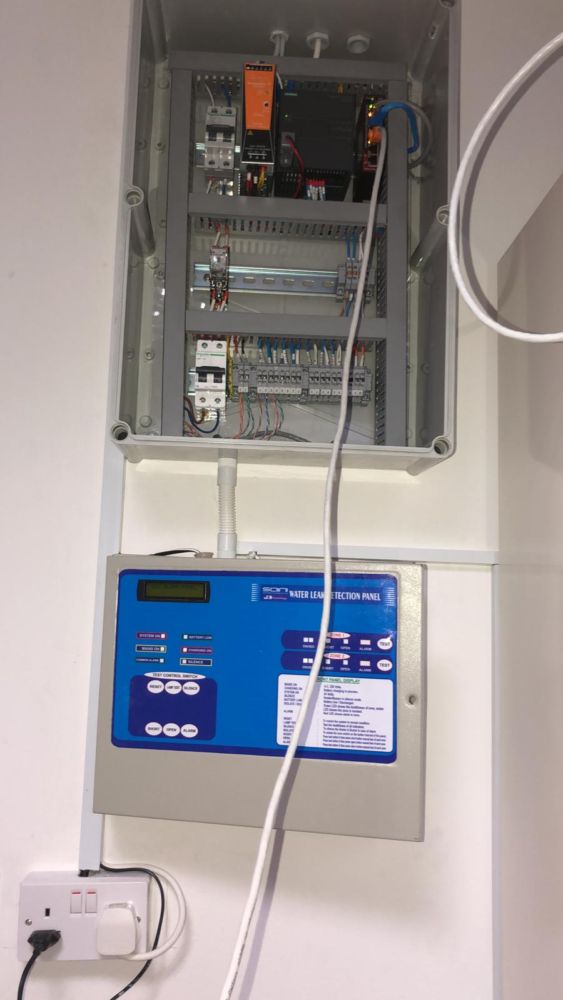
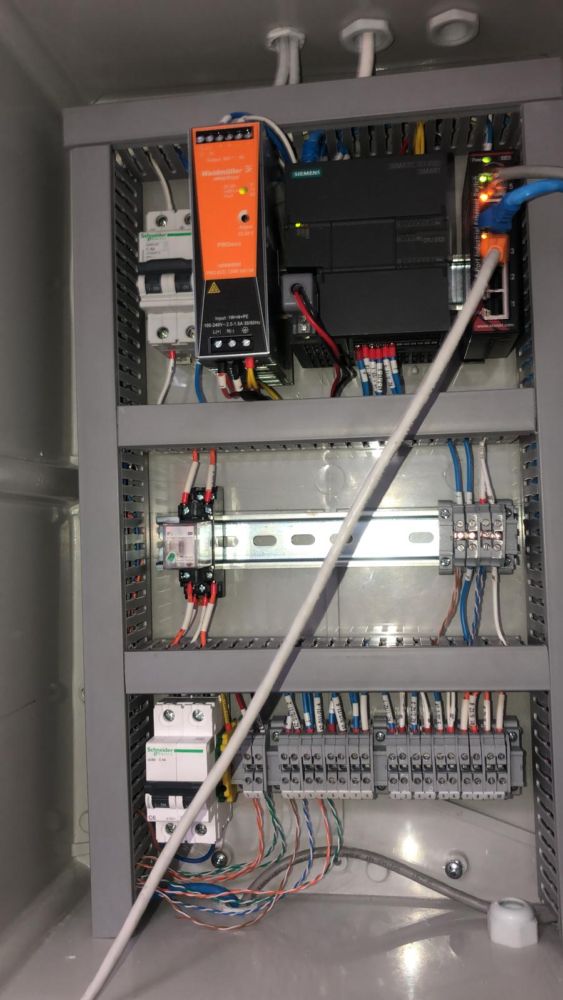
CONSYST implemented a web-based data monitoring solution that can capture and monitor the temperature and humidity inside the data center and generates alarms when water leak is detected. The System mainly has a DAQ Panel with a Data Gateway, which reads the data from sensors and IO modules. The temperature and humidity is measured using a Temperature+Humidity sensor. Two numbers of such sensors are installed at different locations of the data center. The sensor communicates with the Data Gateway through Modbus RTU on RS485 protocol.
A cable type water sensing element is also installed below server racks for detecting the water leakage, and a leak detection controller is installed near to the DAQ Panel. The sensor cable detects the water leak, and an NO contact is available from the Leak Detection Controller to monitor the leak detection status. This signal is integrated to the Gateway using a RIO module.
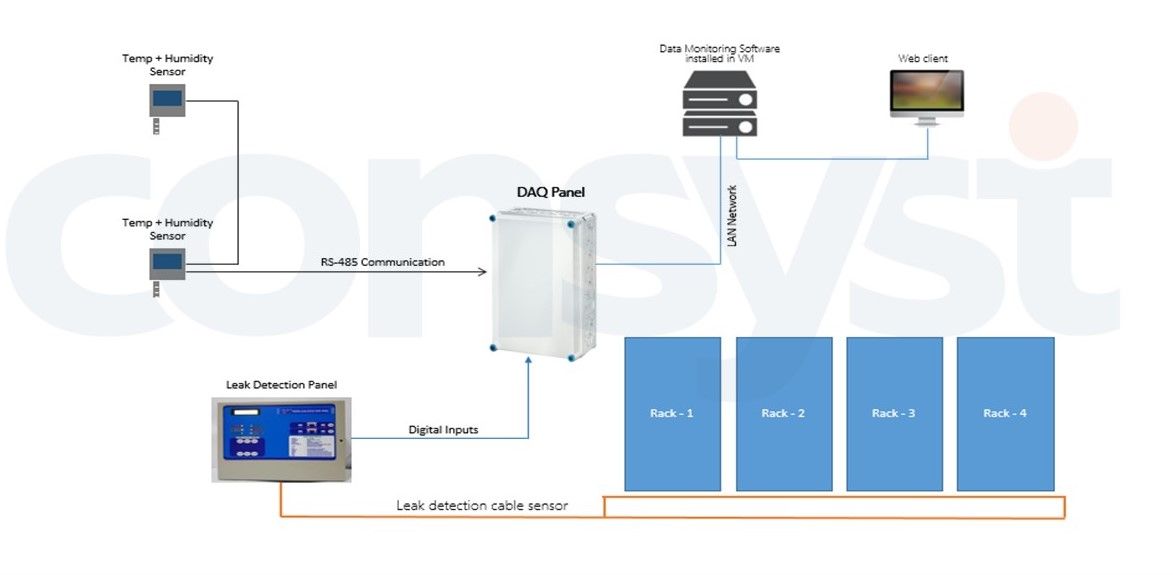
The Data Gateway is connected to the LAN network of the Data Center. A web based data visualization software is installed on a Virtual Machine in one of the servers. The software captures the data from the Gateway, stores the data on a high performance time series database, and visualizes the data on Dashboards. The data can be visualized using trends, graphs, charts etc on dashboards. The dashboards can be accessed by multiple authorized users. Additionally, email alerts are configured to maintenance people and other officials during critical events like temperature/humidity hike, water leak detection etc.
Result
- Critical events are notified using email/sms alerts which helps to take quick maintenance action.
- The availability of historical data helps to find out issues that happened in the past.
- Reduced the number of periodic maintenance visits.